Introduction & Summary
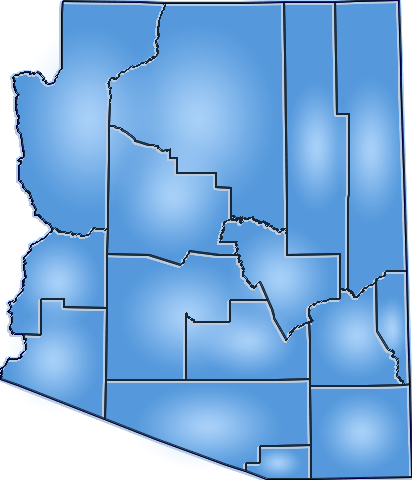
Shift-share analysis produces results that can be valuable for diagnosing, describing and building understanding of major differences between the industry pattern of employment growth locally and nationwide trends. Choose from Arizona's 15 counties, select any time interval between 1969-2000 under the Standard Industrial Classification (SIC) or from 2001-2022 under the North American Industrial Classification System (NAICS), and generate shift-share analysis results for local employment growth compared with the nation at large. This module outputs graphical representations of employment growth for the given time interval, a tabular summary of shift-share results, a tailored disucssion on how to interprete the results, and a thorough technical summary of how the results are derived.
Directions
Click to view one or more of the regional classifications listed below or from the "Analysis Options Menu" to the right. (Note: You may need to scroll down to view the entire selection menu.)
- From the map above or the "Analysis Options Menu" to the right, select a region that you wish to examine in your analysis.
Additional Suggested Analysis
To view and examine the short vs. long term growth of all 15 Arizona counties click on the graph below.
Total Employment Growth by County
County vs Statewide Average: 2013-2021 and 2022
Shift share analysis and shift share tools brought to you by REAP provide shift share analysis of selected regions for total employment growth. Shift share analysis or Shift-share analysis provided on this website display an overview of how shift share analysis results are calculated and more detailed shift share analysis results in various data tables. Shift share formulas are also provided to demontrate the shift share calulations for the shift share statistics shown.
If you would like more information on shift share analysis, shift share formulas, or just general information of shift share, please contact us.


